 |
Location Analytics Is Key! Solutions utilizing location analytics and location as a platform are critical for business development and automation. Location analytics visualization tools take companies from a static to a dynamic view of their customer. They enable network enhancements and expansions, increase operational performance, geographically illustrate boundaries and coverage areas, and enhance customer targeting efforts through high-precision location-enabled triggers. Integrating real-time location analytics into business processes enable carriers to deliver a better customer experience, identify new market opportunities, optimize marketing efforts and gain powerful insights into consumer behaviour. Download our newest whitepaper to learn more >> Visit our website for more whitepapers >> |
Thursday, May 1, 2014
Location Analytics Working for Telecoms

Friday, December 20, 2013
How does Santa use Big Data?

We sometimes take what jolly old Saint Nick does for granted and how much work it takes to visit all of those houses in one night.
BUT, what if Santa used location and Big Data to make the process more efficient?
What if Santa could:
- Determine where changes have occurred since last year?
If Santa used his list, location and neighbourhood level data - he could do the following:
- Identify the new addresses and postal codes that were added since last December
- Understand the age of neighbourhoods – who has a new roof vs. an old roof so he can safely land his sleigh
- Use neighbourhood projections for population changes to efficiently plan for future Christmas’ that have yet to come
- Double check who is on the naughty/nice list?
- Confirm names with addresses and institute elf approved data quality standards
- Identify business addresses that he doesn’t need to visit because everyone is at home nestled snug in their beds with visions of sugarplums dancing in their heads
- Ensure the best flight path?
Wait – can Santa optimize his route to town?
Santa has decided to upgrade his sleigh navigation system to include address points so that he can see everybody and check them off his list as he delivers his parcels and goodies.
Merry Christmas and Happy Holidays from everyone at DMTI Spatial!
Wednesday, December 18, 2013
Webinar: Uncovering the Value of your Database
It’s not too late to register for the
In joining our webinar you will see how Union Gas was able to increase uptake of their marketing programs by 400% and how a leading Telco was able to increase their win rates to 40%. You will learn how to mine your database and turn it into a ‘DIAMOND’ that will increase your marketing ROI by being able to:
|


Wednesday, December 11, 2013
The Importance of Demographics
DMTI has just announced
a partnership with Environics Analytics, premier marketing services and data
analytics company in Canada, to provide their leading demographic content
within Location Hub®
and Location Hub Portal.
The importance of demographics cannot be understated or
ignored. Often, this information is most valuable to a marketer in the
development of messaging and collateral that best suits the customer’s tastes
and increases their return on investment. However, demographic information also
provides data important to segmentation and analysis in defining trade areas,
site selection and risk analysis.
Combining demographic information with other data such as
business listing information (such as SIC codes, NAICS codes, contact
information, sales volumes and mailing address) and consumer details (name
& phone number of the resident) allows a user to access a growing ecosystem
of content. When this ecosystem of content is leveraged using the precise
location information natively provided by DMTI, any business is provided a
single, complete view of the customer that can be utilized across their entire
organization.
Take risk analysis as an example. Every organization will
have an acceptable threshold for risk and this can be calculated using factors
pertinent to their business. When assessing the risk in your book of business, factors
such as the probability to default, the concentration of customers in the same
area and the proximity to a peril or previous natural disaster in the region (such
as a flood or fire) can all be taken into account. Relating these factors to
one another using demographic, business and personal information, a more
accurate exposure model can now be developed.
Location, demographics and personal information are
continually proving invaluable to increasing response rates to marketing
campaigns, but don’t let marketers reap all the rewards. DMTI Spatial can work
with you to ensure that your organization can make use of all the rich content
available in the ecosystem provided at
the address level to gain unprecedented insights.

Take a look at the content for yourself within Location Hub Portal. All the information is provided in an easy to use UI that
allows for the content you need to be searched, selected and appended to your
file. Derive insights to increase campaign effectiveness, create more accurate
risk or exposure models or gain more information on your current customer base
to influence future strategy.
Precise location and an ecosystem of content. Let DMTI Spatial work with you to let you uncover possibilities just a few days ago seemed unthinkable.
Monday, December 9, 2013
How do you measure your risk?
Follow us on Twitter @DMTISpatial
More businesses are realizing the value of measuring risk using location. An example from the insurance industry of this is the accumulation of risk.
“An accumulation of risk occurs when a portfolio of business contains a concentration of risks that might give rise to exceptionally large losses from a single event. Such an accumulation might occur by location (property insurance) or occupation (employers’ liability insurance), for example.”
Accumulation risk is measured in response to or plan in advance of natural catastrophes and earthquakes.
In Canada, risk is measured using both generic and specialized regions. Generic regions include postal code boundaries and municipalities. Specialized regions such as those for earthquakes include Catastrophe Risk Evaluating and Standardizing Target Accumulations (CRESTA) zones to determine the accumulation of risk.
As per the Institute for Catastrophic Loss Reduction, Canadian reinsurers, insurers and regulators use CRESTA zones as the minimum standard for the capture of data and first level calculation of probable maximum loss (PML). PML evaluations can influence underwriting decisions, and the amount of reinsurance allowed on a risk can be predicated on the PML valuation.
The original CRESTA zones were established in 1981 and introduced in Canada in 1986. They have been recently re-worked globally and have been re-launched to the market for 2012/2013.
| Three of Canada’s four largest cities are located in regions of high to moderate risk of earthquake damage – Vancouver (pictured right), Montreal, and Ottawa. Additional vulnerable communities include Victoria and Quebec City. |  |
CRESTA zones can also be mapped against FSA (first three digits of the postal code) to determine the percentage (%) overlap of a CRESTA zone to help determine affected land area.
Users can interact with the CRESTA boundaries in the following ways:
- Obtain mapping data and tables to perform their own internal analytics;
- Take their portfolio (book of business) and assign the CRESTA value (e.g., Extreme, Very Low) that identifies the risk of an earthquake to occur in a specific area/region
Contributed by @RobertSzyngiel
Tuesday, December 3, 2013
 |
WHITEPAPER Smart Marketing - 5 Ways Big Data and Location Economics Increase Marketing ROI Revolutionize the way your company does business by incorporating Big Data and Location Economics, a winning combination, that is a marketer’s competitive advantage in the ever changing and fast pace marketing landscape. Lean how you can increase your ROI by creating a single view of you customer to spot new cross-sell and up-sell opportunities, identify potential customers and increase overall campaign effectiveness. |
Thursday, November 21, 2013
Happy Belated GIS Day 2014! – A picture (or map) is worth a 1000 words
Yesterday being GIS Day and this being Geography week, we wanted to provide some context around GIS and it's origination.
GIS Day was first celebrated in 1999 in order
to celebrate the various uses of Geographical Information Systems (GIS).
The term
"Geographic Information System" (GIS) was coined by Roger Tomlinson
in the year 1968 in his paper "A Geographic Information System for
Regional Planning".
“A geographic information system (GIS) is a system
designed to capture, store, manipulate, analyze, manage, and present all types
of geographical data.”
One of the definitive outputs from a GIS is a map which is
used to communicate results to the end user.
Different terms defining the value of using maps have also evolved over the years from:
“Location Intelligence is the capacity to organize and understand
complex phenomena through the use of geographic relationships inherent in all
information.”
to
“Location Economics leverages location-based information to deliver deep analytical
insights into business planning and operations.”
Regardless of which term is applied to the use of location – data when presented in a visual medium such as a map can tell a story to meaningfully engage stakeholders.
The key is
how to tell an effective story without inundating your end users with the
technical details so that the business can see the insights and make them
actionable.
Friday, November 8, 2013
Single View of the Customer
Many organizations struggle with finding a single view of their customers because often this information is spread across different business units. Ultimately, your organization has a separate conversation with customers about each product. To ensure consistent communication and better identify product upsell opportunities, you require a single view of the client and his/her product portfolio.
Customer Records
The following diagram shows a customer situated within three separate databases – savings, mortgage and credit card. DMTI can help create a single view of your customers by assigning a unique address identifier (UAID) to each client record. The UAID links information across your multiple databases for a more consolidated picture of the customer.


Customer Records
The following diagram shows a customer situated within three separate databases – savings, mortgage and credit card. DMTI can help create a single view of your customers by assigning a unique address identifier (UAID) to each client record. The UAID links information across your multiple databases for a more consolidated picture of the customer.

Customer Patterns
This next diagram shows how you can group customers based on their product portfolios after linking client information from multiple databases. For example, green dots represent customers with one product while blue dots represent those customers with two products. You can view consumption patterns that were previously captured within separate databases or spreadsheets. This allows you to review product penetration or uptake rates and visualize product trends in specific neighbourhoods. You benefit by building strong marketing campaigns. For instance, you can target those individuals with two or less products by creating tailored messaging highlighting the benefits of adding additional products to their portfolios.

Full Customer Information
The final image shows a customer displayed on a map after you link all products using that customer’s address. This demonstrates the ability to quickly look up specific customers and access information across all product lines. When a customer calls regarding account changes or inquiries, this enables faster and more informed responses.

Solution
We can help you link multiple databases to create a single customer view. This leads to better insight which increases profitability and decreases turnover. Visit www.dmtispatial.com for more information or send us an email at info@dmtispatial.com.
Thursday, October 31, 2013
Addressing the Internet of Things
by Robert Szyngiel, Director, Product Management (Data/OEM Partnerships), DMTI Spatial
In the 21st century, connectivity plays any important role. Everywhere we go, connectivity surrounds us. At the office, at home, in the car, our society today depends and relies on being connected in some way.
Everything that we do today, connectivity plays a significant role. Our phones seamlessly connect with our cars through Bluetooth and instantly we have hands free calling. Our TV’s connect with the internet to provide us with entertainment at the blink of an eye. Even when we go shopping, RFID tags are added to merchandise on store shelves allowing for product to be replenished faster for customers. Connectivity affects all of our lives in some way.
At first, it would seem that it is only the devices are having this conversation.
But there is something larger being created – the Internet of Things.
As per the European Commission - Information Society and Media DG – the Internet of Things is defined as:
“A world where physical objects are seamlessly integrated into the information network, and where the physical objects can become active participants in business processes. Services are available to interact with these 'smart objects' over the Internet, query and change their state and any information associated with them, taking into account security and privacy issues.”
All of this communication will be enabled without requiring human-to-human or human-to-computer interaction. All of these combined connections will strengthen the power of this ecosystem and its ability to deliver new insights.
The SRI Consulting Business Intelligence group has suggested a technology roadmap for the Internet of Things.

We now find ourselves in the period (2010-2020), where more vertical-market applications will be developed as the location awareness between people and everyday objects increases.
One of these everyday objects are the addresses where we live and work.
Through the identification and pervasiveness of each unique address and its location – new conversations between machines and humans can be enabled.
Examples include:
Gartner has indicated that most enterprises and technology vendors have yet to explore the possibilities of an expanded Internet and are not operationally or organizationally ready.
Four basic usage models that are emerging include:
These can be applied to people, things, information, and places (or the four “internets”), and therefore the so called “Internet of Things” will be succeeded by the “Internet of Everything.”
The address will be a crucial link between people, things, information and places.
This important piece of the internet of everything is already online.
@RobertSzyngiel
Read more on CanMap® Address Points, the most accurate Canadian individual address points at rooftop and parcel level here >>
Everything that we do today, connectivity plays a significant role. Our phones seamlessly connect with our cars through Bluetooth and instantly we have hands free calling. Our TV’s connect with the internet to provide us with entertainment at the blink of an eye. Even when we go shopping, RFID tags are added to merchandise on store shelves allowing for product to be replenished faster for customers. Connectivity affects all of our lives in some way.
At first, it would seem that it is only the devices are having this conversation.
But there is something larger being created – the Internet of Things.
As per the European Commission - Information Society and Media DG – the Internet of Things is defined as:
“A world where physical objects are seamlessly integrated into the information network, and where the physical objects can become active participants in business processes. Services are available to interact with these 'smart objects' over the Internet, query and change their state and any information associated with them, taking into account security and privacy issues.”
All of this communication will be enabled without requiring human-to-human or human-to-computer interaction. All of these combined connections will strengthen the power of this ecosystem and its ability to deliver new insights.
The SRI Consulting Business Intelligence group has suggested a technology roadmap for the Internet of Things.
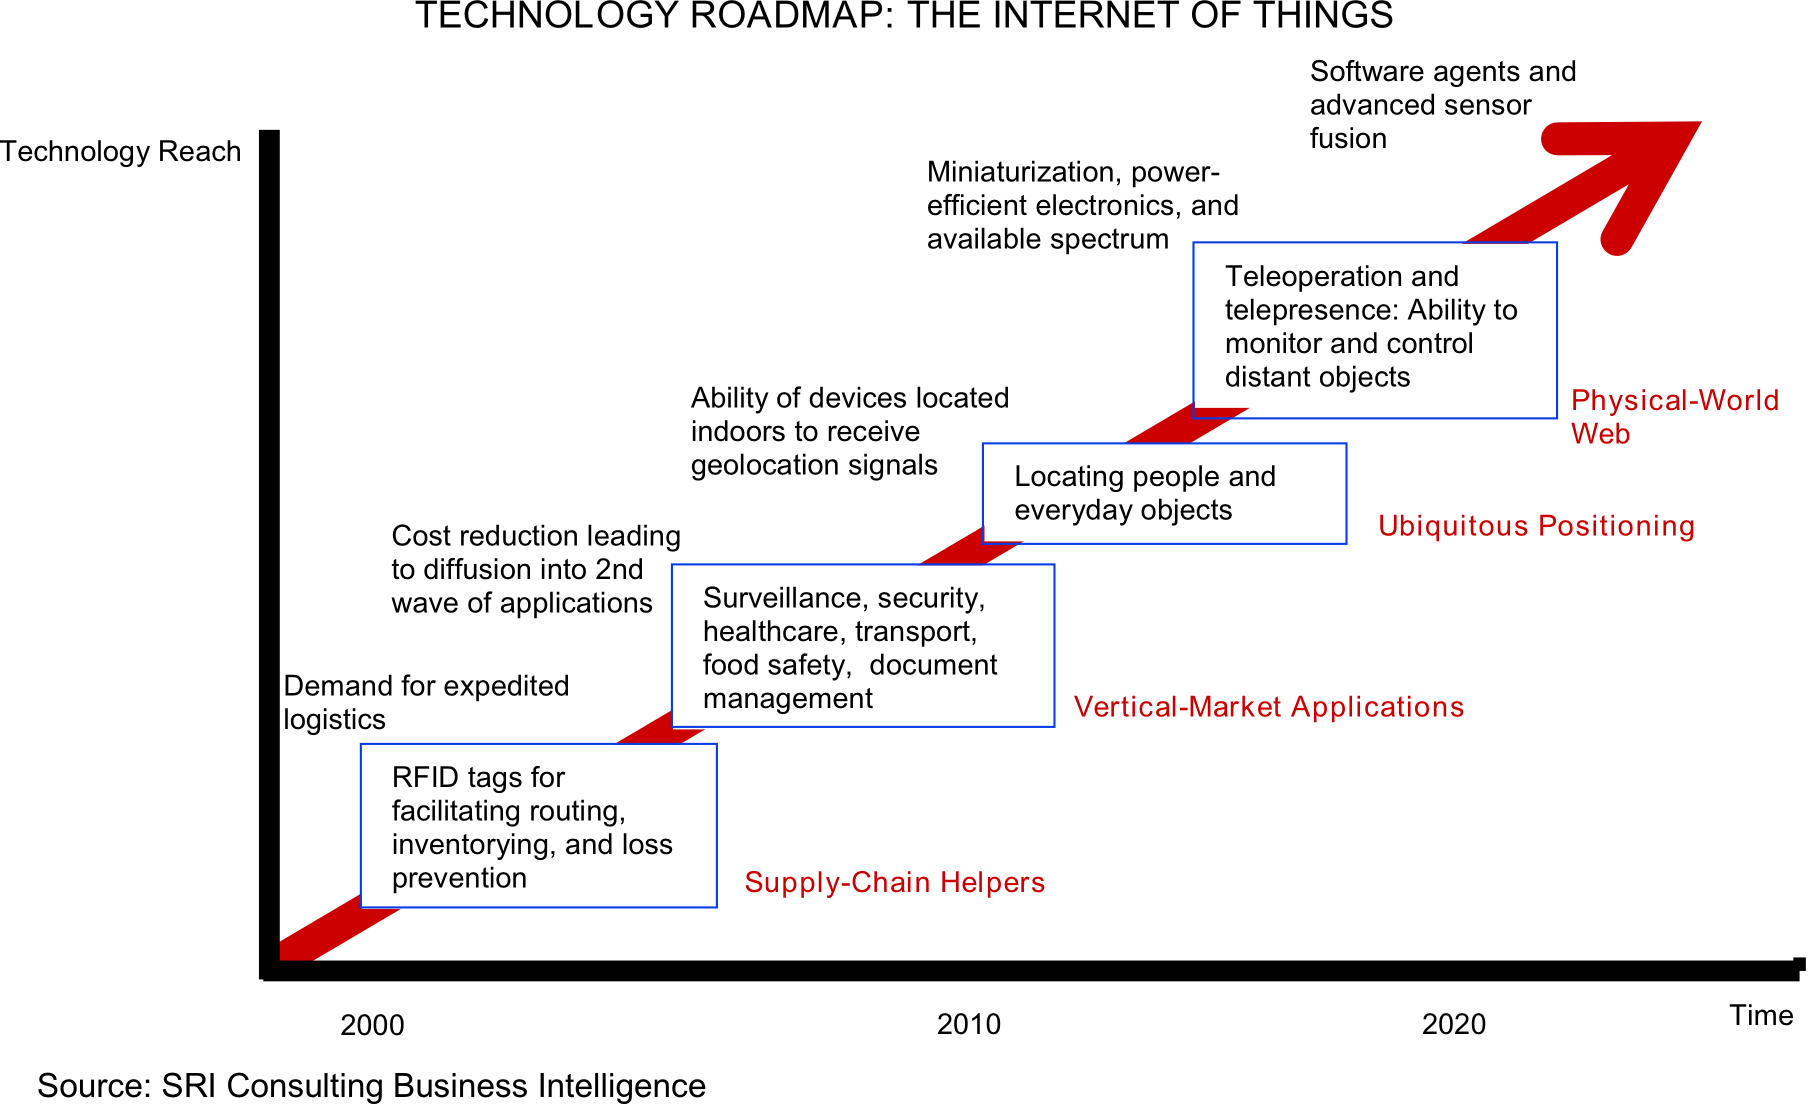
We now find ourselves in the period (2010-2020), where more vertical-market applications will be developed as the location awareness between people and everyday objects increases.
One of these everyday objects are the addresses where we live and work.
Through the identification and pervasiveness of each unique address and its location – new conversations between machines and humans can be enabled.
Examples include:
- A home owner leaves their house and the phone communicates with the house to arm the alarm as the home owner leaves their geo-fence
- The business needs to calculate the precise distance between the address (home/business) and the network to decide how to best service the end customer
Gartner has indicated that most enterprises and technology vendors have yet to explore the possibilities of an expanded Internet and are not operationally or organizationally ready.
Four basic usage models that are emerging include:
- Manage
- Monetize
- Operate
- Extend
These can be applied to people, things, information, and places (or the four “internets”), and therefore the so called “Internet of Things” will be succeeded by the “Internet of Everything.”
The address will be a crucial link between people, things, information and places.
This important piece of the internet of everything is already online.
@RobertSzyngiel
Read more on CanMap® Address Points, the most accurate Canadian individual address points at rooftop and parcel level here >>
Thursday, October 17, 2013
DMTI Spatial has been acquired by Neopost!
| We are thrilled to announce that DMTI Spatial has been acquired by Europe-based mailroom solutions provider Neopost. Click here to read the full press release >> |
 |
| “The DMTI team is thrilled to be joining Neopost,” said John Fisher, CEO, DMTI Spatial. “This acquisition will benefit DMTI and most importantly, our customers. Neopost will provide DMTI with the necessary investment to continue building rich, location-based solutions for our customers and partners.” As the European leader and global supplier of mail solutions, Neopost is progressively building a portfolio of new activities to enhance its offer and support its clients’ needs in areas of Customer Communications Management, Data Quality and Shipping Solutions, including logistics and traceability. DMTI Spatial will join the Data Quality and Master Data Management business unit, Neopost’s fastest growing product segment. Client server and software-as-a-service (SaaS) solutions developed by DMTI Spatial are adaptable to other countries and cultures and effectively complement Neopost’s portfolio of customer and address-focused solutions. The acquisition will enable both companies to deliver exceptional product and software offerings to a global market. Neopost has presence in 90 countries with 5,900 employees and annual sales of CDN $1,417 million (€1,007 million) in 2012. Neopost is positioned in the visionaries’ quadrant of Gartner’s influential 2013 Magic Quadrant for Data Quality Tools. Gartner has stated that the market for data quality tools has become highly visible in recent years as more organizations understand the impact of poor-quality data and seek solutions for improvement. Gartner estimates that this market reached $960 million in software revenue at the end of 2012. |
|
Wednesday, October 16, 2013
Optimizing Business Location Placement
Deciding where to place new business locations is an important decision. You’re looking to optimize placement while considering the proximity of your current and prospective customers, your other existing locations, and the placement of your competition. These factors can all affect your profitability.
Prime Location
In the diagram below the three stars represent prospective locations for a new branch. This particular municipality has a river and controlled access highways (displayed in red) that restrict mobility and the amount of time it takes to reach a location. While a customer may appear close to your prospective location, the actual amount of time to reach your branch may be longer than expected due to restrictions on his/her mobility. Therefore, the customer may not visit your branch since it’s too far.

Drive Time Analysis
Drive time analysis is the act of illustrating how far an individual can drive from a particular point in any direction within a given time. By connecting the ends of all possible routes, you end up with a boundary surrounding the initial point. The second diagram demonstrates this with the coloured zones that surround the potential locations from our first diagram.
The results of drive time analysis provide you with a great deal of insight. You can segment current clients by which drive time boundary their addresses fall within (the green, peach and purple zones) to group them by branch. Additionally, you can identify where two potential branches overlap (the red zone) and compete for the same individuals, hurting your overall profitability. You can also run drive time analysis multiple times and make slight changes to branch placement until you've found an optimal location.

Solution
Through drive time analysis, DMTI can help you determine the best locations to build new branches. Maximize profitability by placing your branches in the optimal locations to capture market share.
Visit our website for more information or try our interactive demo.
Prime Location
In the diagram below the three stars represent prospective locations for a new branch. This particular municipality has a river and controlled access highways (displayed in red) that restrict mobility and the amount of time it takes to reach a location. While a customer may appear close to your prospective location, the actual amount of time to reach your branch may be longer than expected due to restrictions on his/her mobility. Therefore, the customer may not visit your branch since it’s too far.
Drive Time Analysis
Drive time analysis is the act of illustrating how far an individual can drive from a particular point in any direction within a given time. By connecting the ends of all possible routes, you end up with a boundary surrounding the initial point. The second diagram demonstrates this with the coloured zones that surround the potential locations from our first diagram.
The results of drive time analysis provide you with a great deal of insight. You can segment current clients by which drive time boundary their addresses fall within (the green, peach and purple zones) to group them by branch. Additionally, you can identify where two potential branches overlap (the red zone) and compete for the same individuals, hurting your overall profitability. You can also run drive time analysis multiple times and make slight changes to branch placement until you've found an optimal location.
Solution
Through drive time analysis, DMTI can help you determine the best locations to build new branches. Maximize profitability by placing your branches in the optimal locations to capture market share.
Visit our website for more information or try our interactive demo.
Tuesday, October 8, 2013
Birds of a Feather Flock Together
There is an old adage within marketing that “birds of a feather flock together.” Individuals of like characteristics tend to cluster together within neighbourhoods. Therefore, by targeting marketing campaigns at the neighbourhood level, you can increase overall campaign effectiveness through more precise segmentation of address information.
Current Paradigm
Canadian marketers currently tend to rely on census or postal codes to segment customers geographically. This is represented in the diagram below with the coloured areas representing different 3-digit postal codes. While these methods allow you to divide your market, they still result in fairly large territories. It’s possible to get more granular to increase the level of segmentation.

Micro Neighbourhoods
DMTI has developed the concept of a micro neighbourhood. This is a way of geographically segmenting based on addresses that have a relationship to one another such as demographic profile or technology spending. Looking at the second image, we’ve zoomed in on the original pink neighbourhood from our first diagram to see individual houses with a common property valuation. Individual addresses are marked via the yellow dots placed on each rooftop, and using DMTI technology, you can easily group these individual properties to customize your target marketing efforts and increase effectiveness.

Improved Analysis
In the image below, you can see how micro neighbourhood analysis is used to compare and contrast addresses, with the green and blue dots representing current and potential customers respectively. When you begin a marketing campaign, you immediately benefit through the ability to analyze existing customers and new prospects at the same level of granularity. You can also use your own criteria to define the scope of these micro neighbourhoods; they can be as granular as required depending on the level of localization desired. An additional benefit is your ability to run campaigns at the address level without obtaining client contact information such as name and phone number, which are often hard to come by.

Solution
DMTI Spatial can help you group addresses based on geographic location and common characteristics. You can now analyze current and prospective customers side-by-side to develop highly targeted marketing campaigns that will increase profitability.
Visit our website for more information or try our interactive demo.
Current Paradigm
Canadian marketers currently tend to rely on census or postal codes to segment customers geographically. This is represented in the diagram below with the coloured areas representing different 3-digit postal codes. While these methods allow you to divide your market, they still result in fairly large territories. It’s possible to get more granular to increase the level of segmentation.
Micro Neighbourhoods
DMTI has developed the concept of a micro neighbourhood. This is a way of geographically segmenting based on addresses that have a relationship to one another such as demographic profile or technology spending. Looking at the second image, we’ve zoomed in on the original pink neighbourhood from our first diagram to see individual houses with a common property valuation. Individual addresses are marked via the yellow dots placed on each rooftop, and using DMTI technology, you can easily group these individual properties to customize your target marketing efforts and increase effectiveness.
Improved Analysis
In the image below, you can see how micro neighbourhood analysis is used to compare and contrast addresses, with the green and blue dots representing current and potential customers respectively. When you begin a marketing campaign, you immediately benefit through the ability to analyze existing customers and new prospects at the same level of granularity. You can also use your own criteria to define the scope of these micro neighbourhoods; they can be as granular as required depending on the level of localization desired. An additional benefit is your ability to run campaigns at the address level without obtaining client contact information such as name and phone number, which are often hard to come by.
Solution
DMTI Spatial can help you group addresses based on geographic location and common characteristics. You can now analyze current and prospective customers side-by-side to develop highly targeted marketing campaigns that will increase profitability.
Visit our website for more information or try our interactive demo.
Friday, October 4, 2013
The Power of Place
Our last Strategic Insight Session, held on June 25th, 2013 featured Tony Olvet, IDC Canada and Stuart Levings, Genworth Canada as well as Executives from Purolator, Tridel Group, NEXSYS Financial Inc., Project X Labs, ESC Corporate Services and First Canadian Title.
Watch the summary of this event, as well as our other session videos >>
Subscribe to our YouTube channel >>
Watch the summary of this event, as well as our other session videos >>
Subscribe to our YouTube channel >>
Monday, September 30, 2013
Would you put low octane gas in your Bugatti?
Of course you wouldn't, that would be unheard of!
You would spend more to ensure you’re powering it with high octane fuel. The car would still run with lower quality gasoline, but its performance would suffer. CRM tools are similar to sports cars. They’re expensive and powerful, but they’re limited by how they’re powered. Many companies spend thousands of dollars annually on their corporate CRM system. It’s the engine that drives them. As a marketer, you rely on it daily. Yet with such a large spend and high importance, many organizations don’t spend enough effort ensuring the quality of information captured inside.
Customer, prospect and partner information is the fuel of the CRM. Poor data quality leads to communications breakdowns, slower transactions, ineffective analysis and wasted time. Studies show that inaccurate information can result in a 30% revenue decrease. With interconnected systems, CRM data flows into other tools including financial and marketing systems, multiplying the impact of incorrect information. There are a number of causes of poor quality data. Manual user errors lead to missing or incorrect information. Combining multiple sources of data results in inconsistencies and a lack of standardization.
How does your organization ensure it’s working with the highest quality data in its CRM system?
Unlock the Power of Location in your organization >>
You would spend more to ensure you’re powering it with high octane fuel. The car would still run with lower quality gasoline, but its performance would suffer. CRM tools are similar to sports cars. They’re expensive and powerful, but they’re limited by how they’re powered. Many companies spend thousands of dollars annually on their corporate CRM system. It’s the engine that drives them. As a marketer, you rely on it daily. Yet with such a large spend and high importance, many organizations don’t spend enough effort ensuring the quality of information captured inside.
Customer, prospect and partner information is the fuel of the CRM. Poor data quality leads to communications breakdowns, slower transactions, ineffective analysis and wasted time. Studies show that inaccurate information can result in a 30% revenue decrease. With interconnected systems, CRM data flows into other tools including financial and marketing systems, multiplying the impact of incorrect information. There are a number of causes of poor quality data. Manual user errors lead to missing or incorrect information. Combining multiple sources of data results in inconsistencies and a lack of standardization.
How does your organization ensure it’s working with the highest quality data in its CRM system?
Unlock the Power of Location in your organization >>
Wednesday, September 25, 2013
Leveraging Location Insight to Drive Business Opportunity
Today, we live in an increasingly mobile society. Distance and time are reduced by technology and lifestyle. As virtual as the world may appear, we still stand firmly planted in one or more locations from which we live, work and play. At the same time, the data we create has grown in both volume and complexity.
According to a Deloitte report, 85% of all data has a location component. Many businesses are aware of the value that having good data can bring from a business perspective. Ensuring that you have current, correct, complete and accurate location information can help businesses identify new opportunity through more effective targeted campaigns to upsell and cross-sell to existing customers and to improve targeting of new prospects.
According to a Deloitte report, 85% of all data has a location component. Many businesses are aware of the value that having good data can bring from a business perspective. Ensuring that you have current, correct, complete and accurate location information can help businesses identify new opportunity through more effective targeted campaigns to upsell and cross-sell to existing customers and to improve targeting of new prospects.
When data analytics is used correctly and properly, the end result can lead to tremendous success for a business’ marketing efforts and activities. Union Gas for example, was able to leverage location data along with key demographic content to focus their marketing campaign to the right audience with the right message to promote energy conservation programs to eligible clients in an effort to reduce natural gas consumption among this group. As a result Union Gas realized a 400% increase in the uptake rate of their marketing programs.
Monday, September 23, 2013
The Power of Place in Marketing
In this roundtable discussion, sponsored by DMTI Spatial, learn how leading edge marketers are embracing location technologies to drive an increase in campaign ROI.

Now that 85% of data can be directly related to location, the use of Location Intelligence can help give legs to direct mailing pieces and integrate new technologies into the call to action. Location Intelligence is helping direct marketers to get to know their customers in a way they never could before and allowing them to customize who they talk to and what messages they use. This Executive Roundtable discussion brought together LI, creative and marketing industry leaders to talk about how the “power of place” fits into the rapidly changing marketing ecosystem and how, by thinking outside of the box, marketers can boost their campaign ROI.
Visit our YouTube channel for other great videos >>
Now that 85% of data can be directly related to location, the use of Location Intelligence can help give legs to direct mailing pieces and integrate new technologies into the call to action. Location Intelligence is helping direct marketers to get to know their customers in a way they never could before and allowing them to customize who they talk to and what messages they use. This Executive Roundtable discussion brought together LI, creative and marketing industry leaders to talk about how the “power of place” fits into the rapidly changing marketing ecosystem and how, by thinking outside of the box, marketers can boost their campaign ROI.
Visit our YouTube channel for other great videos >>
Tuesday, September 17, 2013
In today’s crowded marketplace, there is immense pressure on marketers to deliver new customer opportunities, increase revenues and differentiate their product offering through successful campaign initiatives.
With over 140 million addressed mail pieces that don’t make it to the intended recipients and 70% of undeliverable mail attributed to people who have moved, marketers must leverage accurate location information to their competitive advantage.
Success begins with accurate and current address information to increase campaign effectiveness, increase ROI by approximately 5% and reduce operational costs associated with erroneous data. Location Economics empowers marketers with the means to assessing the ‘who’ and ‘where’ when maximizing marketing decisions.

With over 140 million addressed mail pieces that don’t make it to the intended recipients and 70% of undeliverable mail attributed to people who have moved, marketers must leverage accurate location information to their competitive advantage.
 |
Success begins with accurate and current address information to increase campaign effectiveness, increase ROI by approximately 5% and reduce operational costs associated with erroneous data. Location Economics empowers marketers with the means to assessing the ‘who’ and ‘where’ when maximizing marketing decisions. |
Success begins with accurate and current address information to increase campaign effectiveness, increase ROI by approximately 5% and reduce operational costs associated with erroneous data. Location Economics empowers marketers with the means to assessing the ‘who’ and ‘where’ when maximizing marketing decisions.
Monday, September 16, 2013
Property Based Decisions
When it comes to property-based decisions, many organizations settle for approximate locations and incorrect, incomplete and outdated address information.
Not being able to determine the accurate location information can mean not being able to tell between a mansion and shack.
The impacts are huge!

The Property and Casualty insurance and home equity based financing industries represent $1 trillion dollars in assets. There are $3.6 billion dollars in annualized insurance premiums and $255 billion dollars in new mortgages approved annually.
So having the precise location is vital.
Have a look at this animated video on "Property Based Decisions"
Not being able to determine the accurate location information can mean not being able to tell between a mansion and shack.
The impacts are huge!
The Property and Casualty insurance and home equity based financing industries represent $1 trillion dollars in assets. There are $3.6 billion dollars in annualized insurance premiums and $255 billion dollars in new mortgages approved annually.
So having the precise location is vital.
Have a look at this animated video on "Property Based Decisions"
Tuesday, September 10, 2013
Well-timed delivery of data from DMTI Spatial helped First Calgary Financial take better care of its members during the Alberta flood crisis
DMTI Spatial published the following piece on the work done with First Calgary in assisting them to take better care of its members during the Alberta flood crisis.
“With the help of DMTI, we were able to identify members living within the flood areas, identify the potential financial impact created by the flood and make quick and impactful member response decisions with complete understanding of the financial implications ”, stated by John Dundas, Senior Vice President, Strategy and Operations at First Calgary Financial.
Download article >>
“With the help of DMTI, we were able to identify members living within the flood areas, identify the potential financial impact created by the flood and make quick and impactful member response decisions with complete understanding of the financial implications ”, stated by John Dundas, Senior Vice President, Strategy and Operations at First Calgary Financial.
Download article >>
Wednesday, August 7, 2013
Driving Value with Location
Stuart Levings, Senior Vice President, Chief Operations Officer with Genworth Canada discusses the value of location in business with Tony Olvet of IDC Canada

Subscribe to:
Posts (Atom)